📊 Key Performance Indicators (KPIs) Overview
The Key Performance Indicators (KPIs) screen allows users to generate reports that track progress against business targets over time.
🔍 Accessing the KPI Screen
To open the KPI screen, navigate to:
Management Reports → Key Performance Indicators → Key Performance Indicators - Details
This view displays KPIs grouped by User.
⚙️ Generating KPI Reports
To generate a KPI report:
-
Go to Management Reports → Key Performance Indicators → Key Performance Indicators - Details.
-
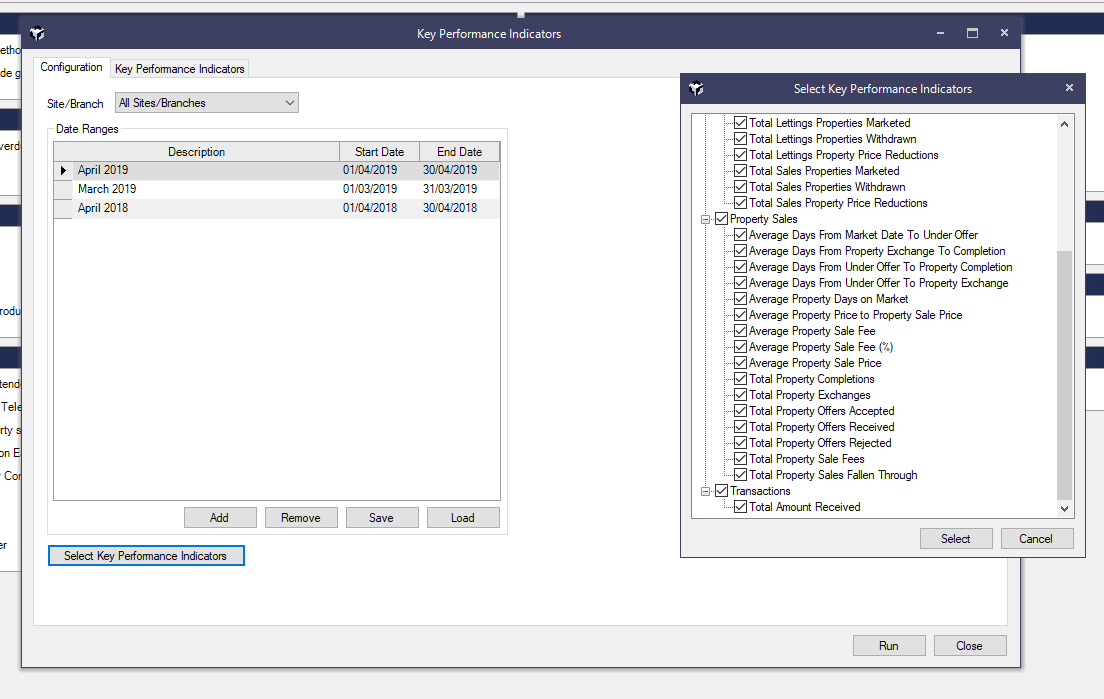
By default, KPIs are generated for All Sites/Branches. You can optionally filter by a specific Site or Branch.
-
The Date Range section defaults to:
-
Last Month
-
Month Before Last
-
Last Month Last Year
You can customize these ranges by clicking Add or Remove.
-
-
Click Run to begin processing. KPI data will be collated and displayed on-screen. You can continue using Acquaint while the report is being generated.
📈 Viewing KPI Graphs
Graph buttons allow visual comparisons:
-
KPI Graph Button: Displays a graph comparing all selected date ranges.
-
Date Range Graph Button: Shows a graph comparing each User’s statistics for the selected date range.
From the graph screen, users can print or save the visual output.
📤 Exporting KPI Data
To export the data grid, click Export. This will generate a flat-formatted .CSV file for external use.
🔐 Permissions & Configuration
-
KPIs will only include data from modules that are enabled in System Configuration.
-
Access to KPIs and other Management Reports is restricted to users with the appropriate report permissions in their User Settings.